
Additive Manufacturing Internal Inspection - Porosity in Aluminum Part
- Sep 26, 2018
- 2 min read
Updated: Feb 12, 2025
Advanced analysis of a CT scan can lead to quantitative solutions to your technical challenges. For example - when that newly designed and printed part needs to be absolutely free of defects. With CT scanning and post-processing, porosity can not only be located in 3D coordinate space, but also quantified by volume, sphericity, and other parameters.
For example, here is an additive manufactured calibration block made of aluminum (photo below). Although undetectable from outside inspection via traditional methods, there is a misprint layer that could compromise the structural integrity of the block.
Aluminum 3D Printed Calibration Block

After CT scanning the part, Volume Graphics software is used to perform advanced analysis.
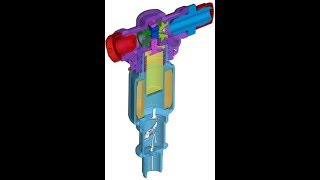
Internal Details of AM Block, Viewed Non-Destructively Using CT Scanning and Volume Graphics

With the part in the Volume Graphics environment, porosity can be detected in additive manufacturing and fully documented. For this exercise, we mapped the porosity of the part and automatically color coded voids based on their volume. An example of those results are shown below.
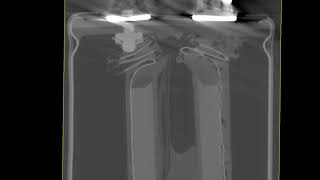
Internal Details of AM Block, with Voids Detected, Mapped in 3D Space, and Quantified for Volume

The lower right quadrant shows the 3D volume with opacity set to show internal features of the actual part. in the remaining three quadrants, a large planar void is shown from X, Y and Z views. Note that the void will be a problem if any machining is done to the part. This void could impact the quality of making the adjacent hole a threaded attachment point, for example.
An .stl of the actual part, including the voids, can be exported. Structural and Thermal engineers can use this .stl to do analysis on the actual geometry of the real part rather than using simplifications based on the CAD model.
Results can also be easily exported as a .csv file.
Internal Details of AM Block, Output File Example of Quantitative Results in .csv

Results can Imported into other advanced analysis tools, or Excel. For example, a simple exercise of mapping the void vs surface area of every void in the calibration block is shown below, using Excel.
Internal Details of AM Block, Simple Example of Quantitative Results Put To Use

This was a example of how CT data can go beyond being a visual representation of data, to being a quantitative tool that can be used for structural evaluation, selection of best designs, and validation that a part is ready for production.
Learn more about advanced analysis of additively manufactured parts, contact us for a free consultation or subscribe to our newsletter for the latest in additive manufacturing inspection and quality control.


Comments